So WinSound has just finished crunching all the numbers,
and you feel like you are staring at a Rorschach test. What do all these
colors mean anyway? Let's start with the squares. Remember that in the
Launch
Analysis dialog you told WinSound To create a rectangular grid of locations
spaced grid feet apart. Well each colored square represents one
of those locations. The exact location is in the center of the square,
but since WinSound has no results for the rest of the square, it regards
the entire square as being the same as the center. This allows you to get
a feel for how well you have chosen your grid size. If your grid was too
large, WinSound probably painted the picture in a fraction of a second,
and the color changes drastically from one square to the next. If your
grid was too small, you probably had to take a coffee break while WinSound
plotted thousands of tiny dots, and the color is so smooth it looks like
it was painted with an airbrush. The ideal grid lies somewhere in between:
The color is adequately smooth (though you can still see squares), and
WinSound takes about a second to draw the picture.
Now about the color--it represents direct sound pressure level. Each square is filled with the color that represents the level at the location in the center of the square. The level represented by the color can be found on the colorbar. The distribution of color that looks like a Rorschach test is a map that gives a quick visual indication of how the sound is distributed to your audience. Use it to zero in on trouble spots--deafeningly high levels or dead zones.
You may ask, so what is "direct sound pressure level?" Basically, it is a measure of how loud it is. In WinSound, direct sound pressure level at a given location is the total sound energy delivered by all speakers to that location. For a given listener's location, every speaker will contribute some sound--even if aimed at a totally remote area. The level indicated by the color is the summed result of the sound from all speakers.
There are some things not included in direct sound that WinSound cannot take into account, and they can be very important. For instance, if a wall is between a speaker and a location, WinSound can't know about it; it assumes the wall is not there. Also, reflections from walls and ceilings are not considered by WinSound. Finally, WinSound does not predict reverberation, which is very important indoors. At remote locations where the direct sound is low, the reverberant sound can be the vast majority of what people hear there. It is up to you to anticipate these effects and judge their relative worth. So why use WinSound if it can't model all this stuff? Because WinSound does allow you to employ the strategy to cope with acoustic anomolies:
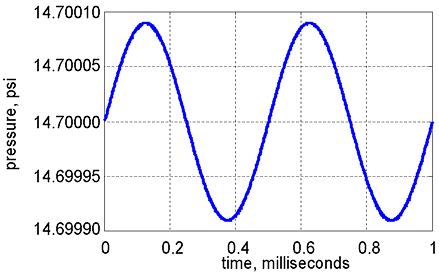
The amplitude is converted to a decibel value based on its size relative to the reference amplitude of 2.9 × 10⁻⁹ psi, which is the smallest amplitude the average person can hear. The formula uses the base-ten logarithm:
where po is the reference level. This formula is used because it produces "nice" numbers. Some rules of thumb with decibels are:
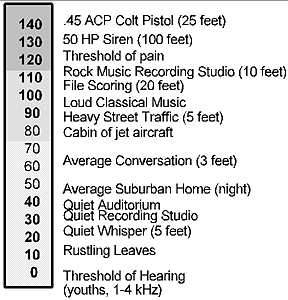
Perhaps the best way to develop a feel for sound level is to purchase an inexpensive sound level meter and take some readings during a typical event (e.g., concert or worship service).
With these relationships in mind, you can use the colorbar intelligently. If, for example, you don't want the quiet portions of the audience to sound less than "half as loud" as the loud portions, you may want to set the minimum level on the colorbar to 10 dB below the maximum. Then any locations with no color (white) must be 10 dB or more below the maximum. You can also autoscale the colorbar (select View | Autoscale Color or press F6). All levels analyzed will then be included, and you get a quick indication of the total range. One word of caution though: Any levels above the maximum will be painted red--the same as the maximum--so you may wish to autoscale first before setting the minimum.
Arguably the most important aspect of sound pressure level
is the potential for hearing damage. The higher the level, the quicker
damage is likely to occur. Table 1 shows one expert's recommendation for
maximum exposure times for various levels.
|
(dBA) |
exposure |
|
|
|
|
|
|
|
|
|
|
|
|
Since the music portion of a typical worship service lasts
between 30 minutes and an hour, the audience should not be subjected to
more than an average of 95 dB. This is especially true for midrange frequencies
(from 500 Hz to 4000 Hz) where the ear is most sensitive. Beyond the recommended
exposure time, the probability of hearing damage becomes increasingly significant.
And tragically, once hearing damage has occured, it cannot be remedied.
The sound map displayed is a map only for one frequency, so if a location's color indicates 85 dB, we only know it is 85 dB at this particular frequency. To see other frequencies, we need to adjust the frequency control. WinSound is a "third-octave" analysis program. In other words, every two neighboring frequencies are a third of an octave apart (the higher frequency is 1.26 times the lower). The total range is from 31 Hz to 20 kHz--the range of the human ear, and the frequencies coincide with those found on a third-octave equalizer. Clicking one of the scroll buttons will advance to the next available frequency. Clicking in the scroll bar will advance one octave in the direction clicked--that is, it will skip the next two frequencies and land on one that is half or double the current frequency. If you drag the thumb (little moving button in the scrollbar), the frequency text indicator will update with the frequency that will be selected if you let go of the thumb. Changing the frequency does not affect the range of the colorbar.
One of the subtler issues to bear in mind when viewing
different frequencies is the directionality of the speakers. At low frequencies
(31 to 250 Hz), speakers are usually "omnidirectional" (see the section
on speaker types for more discussion). Because of this, the resulting sound
map comes from the speakers' locations and has nothing to do with how they
are aimed, so re-aiming them will not help a problem at these frequencies.
Furthermore, keep in mind the frequency below which you choose to model
phase. Table 2 shows some common sound sources and their associated frequency
ranges.
|
|
|
|
| voice |
|
|
| bass guitar |
|
|
| drums |
|
|
| guitar |
|
|
| piano |
|
|
| strings |
|
|
The primary range refers to a sort of "bare minimum" required
where the vast majority of energy is concentrated. The extended range refers
to that needed to do a good job of recreating the sound. For instance,
if a listener gets good response only between 200 and 2000 Hz, you can
conclude that voice reproduction will be adequate. But to make a quality
reproduction of the voice, that range should be expanded to 80 to 10 kHz.
Notice that drums are the most demanding. This is due to the different
types of elements used--bass drum, cymbals, snare, high-hats, etc
For an excellent discussion of frequency and its implications, see Davis
and Jones.
As stated earlier, the Sound Man is the heart of WinSound's analysis. If it sounds too loud, he (or she) will turn it down; if the highs are too soft, he will turn them up through equalization; and so forth Thus, the assumtion is that the Sound Man has the best seat in the house. This becomes the standard against which all other seats are judged.
The Sound Man has power and equalization at his disposal, and he applies them to receive a given sound level at all frequencies. In other words, he is guaranteed to receive a "flat" response. The power is an average over all the frequencies and gives a ballpark idea of the demand he will likely place on the system. If the SoundMan is adding an average of 200 watts of power, and your speakers can only handle 50 watts, you know that your system needs to be expanded or the desired level must be reduced. The average power can be viewed by accessing his popup menu--click the right mouse button over him, and choose view power.
Equalization can be viewed by choosing view equalization from the Sound Man's popup menu. Equalization is plotted in dB for all frequencies, so the plot may look like the equalizer when the Sound Man is through with it. The equalization contains clues about the suitability of the Sound Man's location. If, for example, the equalization at low frequencies is 30 dB, you know that the system is inadequate at low frequencies and needs improvement.
The tutorial describes a common fatal mistake made in countless churches: The Sound Man is placed in a location remote from the focus of the speakers. As a consequence, it sounds muddy (no high frequencies) and soft (low levels), and he compensates by turning up the overall volume and the high frequencies. Listeners down where the action is--totally oblivious to these issues--are shocked that anyone would mix that way. WinSound provides two clues that can indicate this situation: One, if the maximum level in the audience is greater than 4 dB above the level set for the Sound Man; and, two, if the equalization is greater than 3 dB for high frequencies (Look for these clues at several frequencies; sometimes phase interaction or extremely odd speaker directivities may produce these conditions at one frequency).
The Sound Man's height is also set from the popup menu.
Be sure to remember to set it relative to the main floor if he is located
in a balcony. The Sound Man can be moved by dragging with the mouse if
movement is allowed, as indicated by the menu item View
| Allow Movement. It will have a check mark next to it if movement
is allowed. The state is toggled each time it is selected.
Arriving at a satisfactory design involves a lot of experimentation with the speakers. WinSound offers some convenient ways to work with the speakers without having to calculate coordinates and enter them in the Place Speakers dialog. The goal is to obtain a smooth coverage (the variation in level is minimized). An area may receive too much sound for a variety of reasons: The speaker may be too close to the locations, or the relative volume may be too high. Or, perhaps, it is aimed too exclusively at that location. By the same token, an area may have inadequate coverage because it is far away from the speaker, or the speaker is aimed away from it, or its relative volume is too low.
The speaker can be moved in the x-y plane by dragging with the mouse (if movement is allowed, as indicated by the menu item View | Allow Movement). If the speaker has a twin, the twin will be moved accordingly (see the section on the Place Speakers dialog for a full explanation of twins). The height can be changed by accessing the speaker's popup menu. Also, the speaker can be re-aimed by dragging its aim point. The height of the aim point is not affected; it can be set by accessing the aim point's popup menu. Note: if you intend that the aim point is a location in the audience, and the audience area is sloped, you will have to set the height after moving the aim point. The height can be inferred by placing an analyzer on the location and reading the title bar of the Analyzer's response window (see below).
The speaker's relative volume can also be set by accessing either the speaker's or its aim point's popup menu. Remember that this level is only relative to other speakers. Thus, if this is the only speaker in the model (together with its twin if applicable), the relative level will have no effect on the results.
Finally, the electrical power delivered to the speaker
can be viewed by choosing view power
from either the speaker's or its aim point's popup menu. The power in watts
is plotted against frequency. This is where you must learn to use the "eyeball
average." The power curve may have large spikes at one or two frequencies
due to phase interactions or severe directivity effects, and a real sound
operator will rarely tune the system with this much precision. But to assess
the true power required, try to blur your eyes and estimate where most
frequencies are on the curve. However, don't take this number to the audio
store and ask for speakers with this power rating. Even if your analysis
is based on the loudest expected conditions, this number represents a time
average of the power content of your application. The peaks (kick drum
shots, bass slaps, etc
) will likely be much higher. A good rule of thumb
is to allow at least 6 dB of "headroom" for these peaks, and in the world
of electrical power, 6 dB represents a factor of four. Thus, if your "eyeball"
average is 50 watts, your speakers should be rated to handle peaks of 200
watts or more.
While the sound map displays results for all locations but only one frequency, the Analyzer allows you to view the results for all frequencies but at only one location. Multiple Analyzers can be created allowing comparison between various locations. The Analyzer is created by popping up at the location at which you want to view the Analyzer data and choosing open analyzer. The title bar of the Analyzer's window displays the x-y-z coordinates of its associated location.
The title is taken from a common tool in audio engineering. A microphone is connected to the analyzer which sends pink noise (pink noise contains all frequencies at equal energy) to the speaker, and the analyzer displays the frequency response received by the microphone. This allows the technician to adjust the equalizer until the response is flat.
In WinSound, the Analyzer creates a graph window displaying the direct sound pressure level at its associated location over all frequencies. The ideal graph is a flat line at the Sound Man's desired level. If it is a flat line but the level is 10 dB higher, the quality of the sound will be good, but it will likely be too loud (as discussed above). Conversely, the average level may be the same, but the high frequencies may be several dB lower. The sound will probably be muddy--music will lack clarity and brilliance, and voice will lack intelligibility. Perhaps speaker directivity causes the mid frequencies to be several dB higher than the rest. The sound will probably have a piercing, glaring quality to it. Maybe phase interaction causes a jump from 200 to 500 Hz; sounds will be "thick". If you have the opportunity, a good way to get a feel for various frequency responses is to play with the sweepable mid EQ control on the mixer (most intermediate boards have one). Turn the boost all the way up while playing something through the channel, and sweep the frequency control around and listen to the effects.
One handy feature of the Analyzer is its ability to draw
the frequency response dynamically while it is dragged around the sound
map. Position the main window and the response window so that you can see
them both. Click on the Analyzer and drag it around (holding the mouse
button down). Watch the response window to get a quick overview of frequency
response trends in different audience areas.
Davis, Gary
and Ralph Jones. Sound
Reinforcement Handbook. 2d ed., Milwaukee, WI: Hal Leonard,
1989.
Davis, Don and Carolyn. Sound System Engineering. Indianapolis, IA: Howard W. Sams & Co., 1975.
| previous |
|
|