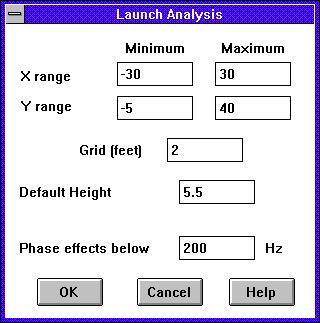
When you have entered all the model data, it is time to let WinSound crunch the numbers for you. Choose Model | Launch Analysis , or press F5. The following dialog appears:
The top five controls specify a rectangular grid within which sound levels will be calculated for all frequencies. The X and Y ranges are initially filled with the ranges of the x and y scales in the main window. All locations analyzed will be within these limits even if the boundaries extend outside the rectangle. Since some points within the analysis range may not lie within a defined boundary, the Default Height defines the height that will be used for these points.
The Grid control specifies how far apart (in feet) the locations will be and should be set with some thought.
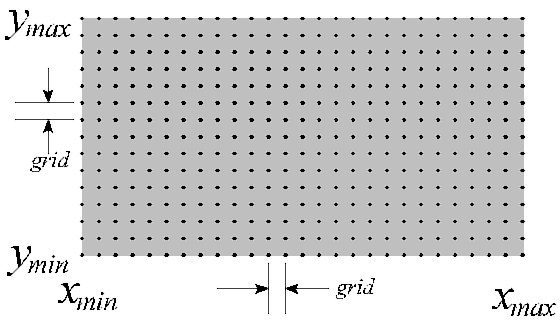
Entering too large a grid will not give enough resolution--that is, it will be hard to know what the level is between locations. On the other hand, entering too small a grid will tax the computer resources heavily, so the analysis will take too long to complete. WinSound will limit the maximum number of locations based on your availabe RAM (4 Mb of RAM will permit about thirty thousand locations--a hefty amount). If you exceed this maximum, it will issue a message recommending the maximum grid size. The number of locations grows with the inverse of the square of the grid--in other words, halving the grid size quadruples the number of locations. Try starting with a 5-foot grid.
The last control, Phase effects below, allows you to choose how the sound from all the speakers is added together. For frequencies above this value, the sound is modeled as acoustic energy. Thus, if two speakers produce the same intensity at a location, they will combine to increase the level by about 3 dB above the level created by just one speaker.
For frequencies up to and below this value, the sound is modeled as a spherical pressure wave. Two waves may add together to increase the level by 6 dB if they add in phase. Alternatively, they may cancel each other out if they add out of phase. The following figure illustrates this effect:
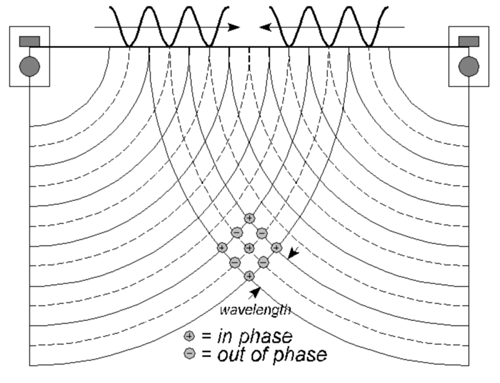
The wavy lines at the top of the graph represent the pressure waves from each speaker. The waves travel outward at the speed of sound, as indicated by the arrows. The waves are represented by the solid and dashed circular lines around each speaker. Imagine dropping two stones into a pond and watching the ripples radiate from the two locations until they reached each other and began to interact. The solid lines indicate the crest of the wave--or high pressure. The dashed lines indicate the troughs of the wave--or low pressure. Wherever the crest of one wave intersects the crest of the other wave, the pressures will add (if they are equal the pressure will double). However, if the crest of one wave intersects the trough of the other wave, the pressures will subtract (if they are equal, the result is zero). This is indicated by the circles with pluses and minuses for a few locations. These are said to be locations of constructive addition (in phase) and destructive addition (out of phase).
Notice that a plus is also plotted at the intersection of the two troughs. Recall that the waves are moving outward at the speed of sound. The distance between two adjacent crests is the wavelength (represented by ) which is equal to the speed of sound (1115 ft/second, or, about one foot per millisecond) divided by the frequency. At the next instant, the solid lines will travel outward to where the dashed lines are. As can be seen from the illustration, the point where two dashed lines intersect will become a point where two solid lines intersect. By the same token, the intersection of a solid line and a dashed line will become the intersection of a dashed line and a solid line. The point is that the locations of constructive and destructive addition do not move, even though the waves are moving.
However, these locations depend on the wavelength, so they are different at different frequencies. For example, the wavelength for 100 Hz is about 11 ft long. Thus, the distance between a constructive-addition point and a destructive-addition point is about 6.5 feet (half a wavelength). If your grid is one foot, you will see a gradual change in level between these locations. But now consider 10 kHz; the wavelength is about an inch and a half. From one location to the other is about 8 wavelengths. In other words, moving from a constructive-addition location to a destructive-addition location only requires a tilt of your head! Again, if your grid is one foot, two adjacent locations may have constructive and destructive addition, so your results will look like a random-color checkerboard.
This is why phase is only considered below the frequency you enter. At higher frequencies, the resulting sound pressure level is found by simply adding the acoustic energy from each speaker. This tends to average the effects of phase addition and cancellation over frequencies near the one being analyzed and gives a better correlation to the effective quality of the sound. 200 Hz ( = 6.5 ft) is recommended as a general maximum frequency for modeling phase effects. Beyond this it becomes doubtful that we even know the exact positions of the speakers or the listeners to a fraction of the wavelength.
Now you have entered your grid; you have specified the sound pressure level for the Sound Man; and you have chosen which frequencies should model phase effects. You are ready to let WinSound crunch the numbers for you. Press OK. If there are any modeling errors with your speakers, WinSound will protest. Otherwise, a progress dialog will appear with the title, WinSound is Number Crunching. The black rectangle will be filled with red when the analysis is done. In the meantime, WinSound allows you to run other applications while it quietly crunches in the background.
| previous |
|
|