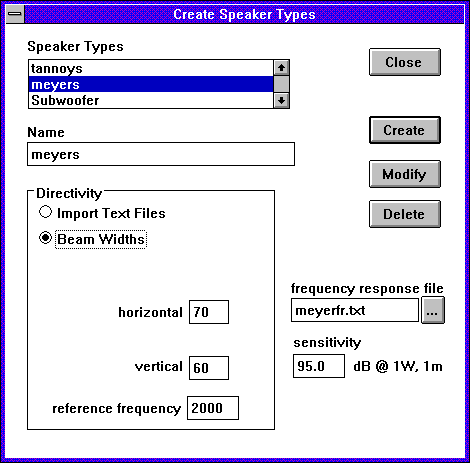
The speaker type contains the information about how the speaker converts electrical energy into sound and how it radiates sound into space. A typical sound system may contain several speakers of the same model. In WinSound, these will all share the same speaker type. Speaker types are created through the dialog which appears when you select Model | Create Speaker Types , or press F1:
A speaker type is defined by its sensitivity, frequency response, and directivity. The sensitivity is the sound pressure level in dB one meter in front of the speaker when one watt of electrical power is put into it. Thus, it has the unit of dBSPL @ 1W, 1m. It is often reported as a single number, but, in truth, this is an average over a range of frequencies, so the frequency response gives us more detail. Thus, if the documentation tells you that the sensitivity is 95 dB, your first question should be, "at what frequency?" For example, suppose the sensitivity of a speaker is rated at 95 dB, and the frequency response is as shown below:
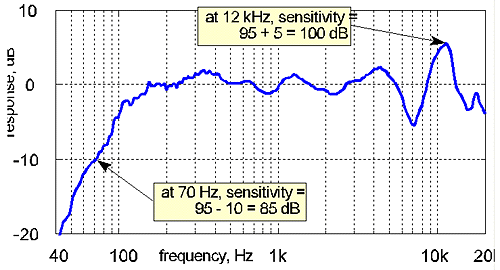
Wherever the frequency response graph reads 0 dB, the sensitivity is 95 dB--the "nominal" value. However, at 70 Hz the frequency response is -10 dB. This implies that the true sensitivity at 70 Hz is 95 - 10 = 85 dB. Likewise, at 12 kHz the frequency response is +5 dB, which implies that the true sensitivity at 12 kHz is 95 + 5 = 100 dB.
Frequency response and sensitivity are entered by means of the two lower-right controls in the Create Speaker Types dialog shown in Figure 2 (above). The sensitivity is entered directly, but the frequency response is entered as the name of a file. The file can be selected by clicking the small button just to the right of the text control. This file should contain two columns of text; the first column is the frequencies, and the second column is the response corresponding to those frequencies (Click here to see the file used to create the response shown above). The values in any row are separated by tabs or spaces. The constraints on this file are as follows: (1) the frequencies need to increase with each row; (2) the response is in dB; (3) each column must contain the same number of values. If the range of frequencies is less than the full bandwidth used by WinSound (i.e., 31 Hz to 20 kHz), WinSound will make some assumptions. Specifically, WinSound will apply 12 dB/octave rolloff for frequencies below the minimum and/or above the maximum frequencies in the file. Otherwise, WinSound will use linear interpolation for frequencies within the range of the file.
Notice the values in the sample file. The response values are all much greater than a few dB. A common way of measuring frequency response and sensitivity is to measure them together at all frequencies, as is done here. WinSound will notice if the average value is greater than 50 dB and will subtract it from the frequency response. It will ask if you would like to use the average as the nominal sensitivity rather than the value entered in the text box. This method is more accurate than entering the sensitivity. However, if for some reason you prefer to use the entered value, tell WinSound no, and it will use the entered value. But WinSound will still subtract the average value internally so that frequency response is still measured with respect to sensitivity.
The easiest way to create the file (if it doesn't already exist) is to use a spreadsheet (such as Microsoft Excel or Borland Quattro Pro). Select the two columns; copy them to the clipboard; open Notepad; choose Edit | Paste; and save the file.
The next question is, what happens if we are not directly in front of the speaker. By experience we know that if we stand behind a speaker, the level is much lower than if we stand in front of it. And the more "in front of it" we are, the higher the level. This is the phenomenon known as directivity. A flashlight exhibits the same behavior with light.
WinSound offers two methods for building directivity patterns. Figure 4 shows the dialog for the simplest method of creating a directivity pattern--entering beam widths. When the Beam Widths radio button is chosen, the controls appear in the directivity box. Many manufacturers of professional loudspeakers do not provide full polar patterns. Instead, they will list the "beam widths" or "dispersion angles". For instance, the specification sheet may have an entry like this:
dispersion angles (-6 dB): 120H by 80V at 2 kHz
This says that in the horizontal plane at 60° (i.e., half of 120°) off the front axis the sound intensity is 6 dB lower than directly in front of the speaker. Likewise, in the vertical plane the intensity is 6 dB lower at 40° (i.e., half of 80°) off the front axis. The "6-dB-down angle" is half the beam width because the "beam" includes both sides of the axis. For instance, if we took our example speaker with its sensitivity of 95 dB and put one watt through it, we would measure 95 dB at one meter directly in front of it. Now suppose we walked around it 60° to one side so that we measure one meter away. Now our reading would be 95 - 6 = 89 dB. Alternatively, we could move the microphone up 40° above the center axis and again read 89 dB. The former reading is the "off-axis response" in the horizontal plane, and the reading could be repeated at all angles in this plane. Likewise, the latter reading is in the vertical plane, and the "off-axis response" could be measured at all angles in that plane. To show these measurements we would use "polar patterns" for the two planes. These polar patterns would look like the following:

The polar plot is a graphical way of showing what happens to the level as we move the microphone around the speaker while holding it at the same distance. Zero degrees always refers to directly in front of the speaker, 180° always refers to directly behind the speaker (where the level drops the most). For the horizontal polar plot, 90° would be a position directly to the speaker's left, and 270° is to its right. For the vertical polar plot, 90° would be a position directly above the speaker, and 270° is directly beneath it.
However, these figures are only true at the reference frequency of 2000 Hz. Often the specification will omit the level drop (-6 dB) and the reference frequency. By convention, a 6 dB drop is implied. No convention exists for the reference frequency, but it is recommended that 2 kHz is used in WinSound if the reference frequency is not given. At frequencies higher than the reference, the beam width usually gets narrower--that is, the 6-dB-down angle gets smaller. At lower frequencies, it gets wider. WinSound will generate the polar patterns for all frequencies based on the horizontal and vertical beam widths and the reference frequency. For frequencies below 250 Hz, WinSound assumes the speaker is "omnidirectional." An omnidirectional speaker radiates sound the same in all directions, so the polar plot is just a circle (using the analogy of light, a lightbulb is almost omnidirectional). The reference frequency should not be lower than 1000 Hz if the resulting pattern is to be realistic. Also, the beam widths should be no less than 40°. Of course, the resulting pattern is only a crude estimate of the true directivity, but it is a useful tool for investigating possible types of speakers without the laborious work of entering the full polar patterns--which brings us to our next point.
The other method for building directivity patterns uses text files that contain the horizontal and vertical polar patterns for various frequencies. When theImport Text Files radio button is selected, the dialog has the following appearance:
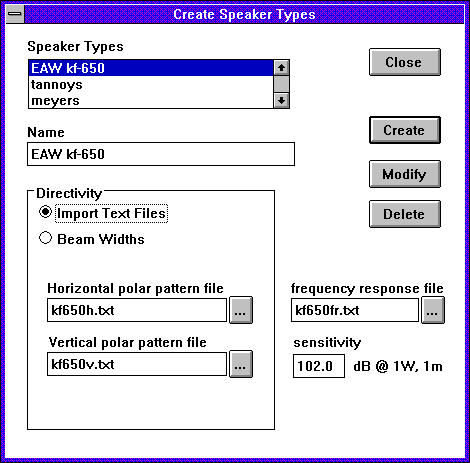
The names of the text files are entered in the text controls. The buttons to the right of the text controls bring up a file dialog so the file can be chosen. As in the case of frequency response, these files will contain numbers arranged in rows and columns. The first row should contain the angles starting from 0° and ending with 360° at which response has been measured. The first column should contain the frequencies for the various polar patterns. Thus, each row is a polar pattern for that specific frequency. IMPORTANT: The first number in the top row is also the first number in the left column. This number has no meaning, but it must be present. A zero is preferred. An example is shown below:
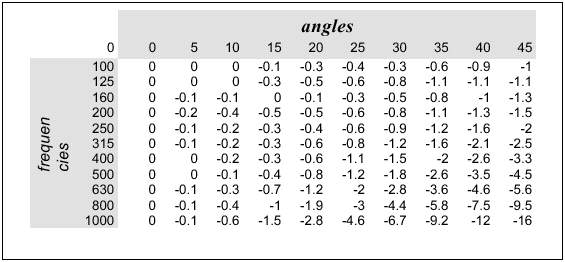
Of course, the lines, shading, and the words angles and frequencies are included only for illustration--the actual file would only contain the numbers, and the angles must continue to the right all the way through 360°. Also, it should contain polar data for higher frequencies as well. The numbers represent "off-axis attenuation"--thus they are usually negative, and all values for 0° and 360° are zero or at least very close to zero. For frequencies lower than the lowest contained in the file, an omnidirectional pattern is assumed. For frequencies higher than the highest contained in the file, the highest-frequency pattern is copied. Example files are included: jf100h.txt and jf100v.txt for the horizontal and vertical patterns, respectively. Again, the best way to build these files is to copy the numbers into Notepad from a spreadsheet.
Once the frequency response, sensitivity, and directivity pattern have been set, give the speaker type a unique name--usually containing the brand and model name--and press Create. If there are any errors in the settings or files, they will be detected and a message will be issued. At this point the speaker type is loaded into WinSound and can be used in placing speakers. Its name appears in the Speaker Types list box. Double-clicking this name will fill the dialog with the properties of that type.
| previous |
|
|