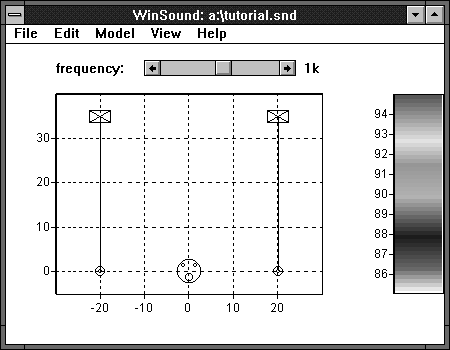
Open WinSound by double-clicking the file winsound.exe from the File Manager or the Windows Explorer. The working environment for WinSound is the main window. The colorful bar on the right is the scale for sound intensity. The "Mr. Bill" toward the bottom is the Sound Man (1). The horizontal and vertical axes indicate position in feet. The scroll bar at the top is the frequency selector; it allows you to view the sound map for any of 29 third-octave frequencies.
The first step is to tell WinSound what kind of speakers you have by creating speaker types. Later, you will specify where these speakers are. By creating speaker types, multiple speakers can share the same type without it being created over and over. This saves you time and it saves the computer memory. Select Model | Create Speaker Types…, or press F1. In this dialog, you define your speaker type by specifying three things: the speaker's efficiency, its frequency response, and its directivity (For a more thorough discussion about the speaker type and its components, see Creating Speaker Types). There are two options for specifying the directivity: dispersion angles or text files containing the polar patterns for the speakers. Check the Beam Widths radio button to use dispersion angles. Enter 120 x 75 at 2kHz for the name of the pattern. Enter 120 for the horizontal, 75 for the vertical, and 2000 for the reference frequency. Next, leave sensitivity at 95 dB, and enter jf100fr.txt for the frequency response file. This specifies a file containing the frequency response for the EAW JF100. Press Create. WinSound will create a directivity pattern with a 6-dB drop at 60 off the horizontal axis (half of 120°) and 37.5 (half of 75°) off the vertical axis at 2000 Hz. At higher frequencies, the drop becomes steeper, and at 250 Hz and below the speaker is omnidirectional (no off-axis attenuation).
Create another type 60° x 40° with the name 60 x 40 at 2kHz. Use the same sensitivity and frequency response. You can build as many speaker types as you wish, but for now press Close.
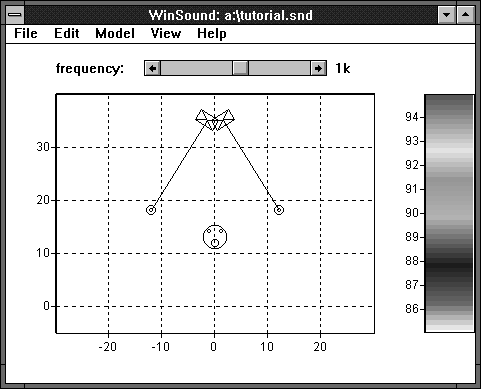
Select Model | Place Speakers…, or press F2. In this dialog you create actual speakers by specifying their position and spacial orientation. For this example you will create a single pair spaced 40 feet apart and mounted on the stage on stands. Enter main pair for the Name. In the Location group enter 20 for x, 35 for y, and10 for Height. To tell WinSound how the speakers are aimed, in the Aim Point group enter20 for x, 0 for y, and 4 for Height. Check the Twin check box, and select the speaker type named "60 x 40 at 2kHz" that you created earlier. Leave the Frequency Cutoffs andRelative Levelat their default values (for more info on these controls, see Placing Speakers). Press Add. You have created the pair. They are 40 feet apart (20 feet from the centerline) and 10 feet high (4 feet for the stage and 6 feet for the stands). They aim straight outward at points in the audience 4 feet high, 20 feet from the centerline, and at y = 0. Thus, a person sitting at the point (20,0,4) would see the right speaker aiming straight at him. Press Close. At this point, WinSound appears as shown below.

The speakers are represented by rectangles with lines joining the corners; the aim points are shown as--what else?--bull's eyes; the speakers and aim points are joined by lines.
Select Model | SoundMan…, or press F4. Leave X and Y at 0, but enter 15 feet for Height to simulate a "sound booth" (also known as the "Crow's Nest") located in the central balcony. Leave Desired Operator Level at 90 dB. This means that the Sound Man will add sufficient power and equalization to receive 90 decibels at all frequencies. This is a central concept in WinSound: the sound operator will do everything he (or she) can to make it sound good to him. Therefore, his listening perspective is the reference against which all others are judged.
Select Model | Launch Analysis…, or press F5.A message box appears reminding you that you have not yet told WinSound where the people are sitting, but it can generate a default "boundary" based on the axes' settings (WinSound offers sophisticated options with which you can tell it where people are sitting. See Creating Audience Boundaries for more information). The listeners' ears are assumed to be four feet above the ground. Accept by clicking yes. The analysis dialog shows the range indicated by the horizontal and vertical axes so that you can change them here if desired. Accept these values, but enter 2 feet for the grid. This means that WinSound will calculate levels for all listening points within the range, and the points will be spaced 2 feet apart (See Launching Analyses for more information on creating grids and other analysis options in this dialog).
Leave Default Height at 5.5 feet. This is the height of listening locations that do not fall within the boundaries--in this example, there are none.
Enter 200 Hz for Phase Effects Below so that at low frequencies WinSound will consider phase interactions between the speakers. At higher frequencies, WinSound will simply sum the direct sound intensity from each speaker as energy. Press OK. A progress dialog will appear with the title, WinSound is Number Crunching. The black rectangle will be filled with red when the analysis is done. In the meantime, WinSound allows you to run other applications while it quietly crunches in the background.
Choose File | Save as… In the file box enter tutorial.wsd and press OK. File saving accomplishes two things: It saves the work of reentering the setup data; and it allows the comparison of two or more possible setups. WinSound will warn you if you are going to overwrite an existing file. Also, you can select File | Save (or press Ctrl-S) to save the current file without having to reselect it in the dialog. Later, you can open the file withFile | Open (or press Ctrl-O); if you try to open a non-WinSound file, WinSound will ignore it and will tell you that it is not a WinSound file.
If you have not moved the frequency scroll bar, it should be set at 1 kHz. The sound map is now a collection of small, colored squares where the color at a square indicates the total sound pressure level at that listening location at that frequency. The system has been adjusted and equalized so that the Sound Man receives 90 decibels at all frequencies, and the color bar has been autoscaled to show all levels at the current frequency of 1 kHz.
Click on the thumb (little moving square) of the frequency scroll bar and drag it all the way to the left (31 Hz). Notice that the loudest points are closest to the speakers, but the quietest points lie near two curves that pass between the speakers. 31 Hz is a very low frequency--few speakers can actually produce it. At low frequencies, these speakers are "omnidirectional." In other words, the speaker radiates sound with the same intensity in all directions; thus, the level received only depends on distance to the speakers and not on where the speakers are aiming. However, certain listeners will be at locations where the wave from one speaker is directly "out of phase" with the wave from the other, and this causes the waves to cancel each other out. Also, recall that the Sound Man receives 90 dB. From the color bar you can see that listeners close to the speakers (where the color is red) are hearing 102 dB--12 more decibels than the Sound Man!
Remember that these speakers' directivity was defined using a reference frequency of 2000 Hz. Let's view the results at this frequency. Click on the thumb of the frequency scroll bar and drag it to the right until the text indicator to the right reads "2k", and let go. The sound map changes to show the results for 2 kHz. Now the positions of maximum level are directly in front of the speakers rather than around them. This is because of the directivity at 2 kHz; the speaker focuses the sound toward its front much the way a flashlight focuses light (objects in front of the flashlight receive more light than objects outside the flashlight's beam). Also, remember that the speakers are 10 feet above the ground, and the listeners are 4 feet, so the speakers are 6 feet above the analysis locations immediately surrounding it.
The color scale no longer reflects the actual range of levels here. SelectView | Autoscale Color, or press F6. WinSound appears as shown below:
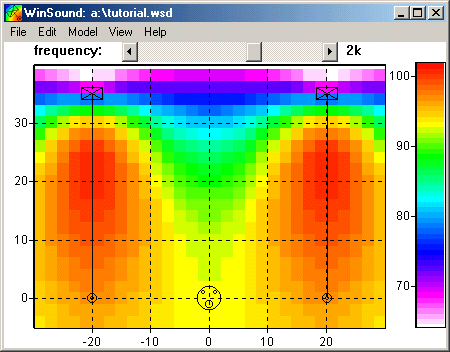
We can now see that at 2 kHz listeners directly in front of the speakers receive 100 dB--10 decibels more than the Sound Man. For more detail, pop up on one of the colored squares in front of one of the speakers and choose open analyzer from the popup menu. A window appears with a graph of the frequency response at that location:
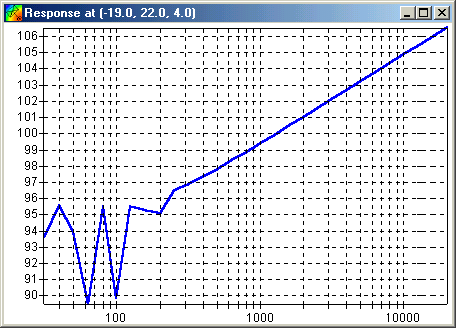
In other words, you can view the levels at this location for all 29 frequencies. Notice that the higher the frequency, the higher the level. Here's why: at higher frequencies, the directivity pattern is narrower (picture yourself "narrowing" the beam on an adjustable flashlight). This means that the Sound Man is receiving less level because he is significantly off the main axis of either speaker (like two flashlights not quite pointing at him). Thinking it sounds muddy, he turns up the high frequencies until it sounds right. But to the people in front of the speakers, it sounded fine before he turned the highs up.
Verify this by popping up on him and selecting view equalization. A frequency-response window appears showing the adjustments he made to the equalizer in order to receive a flat response. The numbers can be copied to the Clipboard by popping up in the graph area and selecting Edit | Copy; then they can be pasted into a spreadsheet for fancier graphics, printing, or more analysis. You can close the window by double-clicking the control box in its upper-left corner.
10 dB is too much of a difference. When the sound operator thinks the level is just right, it will be perceived as too loud by these listeners. Another implication of a difference this large is that the sound operator is probably listening to the reverberant field and can hardly hear the direct sound from the main pair. (6) The crux of the problem is that what the Sound Man hears is vastly different than what most of the audience hears. So when it sounds good to him, it probably sounds terrible for them.
We will now reposition a few things to try to get a better sound distribution. By better we mean two things: (1) The sound will be evenly spread across the listening area, and (2) the Sound Man will hear the same levels as the audience.
Select View | Allow Movement (a checkmark will appear next to the menu) so that you can move things around with the mouse. Click on the Sound Man (Mr. Bill) and drag him forward about a third of the way toward the stage. Pop up on him and select set height. Enter 4 feet (we're putting him in the audience). Now click on the right speaker and drag it in toward the centerline until the pair is just next to each other. Then pop up on one of the speakers and selectset height. A dialog appears allowing you to set the height. Enter 20 feet, and press OK. Physically this represents hanging the speakers from the ceiling in a "cluster". Finally, click on the right aim point (the little bull's eye) and drag it forward about half way toward the stage then drag it about half way to the left toward the centerline (about a third of the total distance from the right edge of the sound map. Select View | Allow Movement again (the checkmark will disappear) to prevent accidental movement. Now select Model | Place Speakers…, or pressF2, and double click on main pair in the list box. The settings should read (approximately):
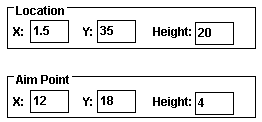
If they don't, you can enter these values. Select the other speaker type created earlier named120 x 75 at 2kHz, and press Modify thenClose. WinSound should now appear as shown in Figure 2.
Move the Analyzer's window and the main window so that you can see them both. Next, double-click the vertical axis in the frequency response window (or pop up in the axis and select Enter Limits), and change its range to a low of 75 dB and a high of 105 dB. Make sure the current frequency is still 2 kHz and launch another analysis by selecting Model | Launch Analysis…, or pressing F5. The original ranges and grid are displayed so press OK. Before number crunching, the Sound Man's equalization window and the Analyzer's response window are updated.
The sound map is now concentrated in the center of the room. The color scale reads from 82 to 92 dB, so the loudest points are only 2 dB higher than the Sound Man. The quiet points are at the back of the room and in the upper corners (verify by opening additional Analyzers as described above). Click in the frequency scroll bar just to the right of the thumb. The current frequency changes to 4 kHz--one octave higher than the last. Click again to 8 kHz and again to 16 kHz. The sound map splits into two hot spots corresponding to the two speakers' narrow beam widths at high frequencies. Click again to 20 kHz. This is the highest frequency available and can be heard by only the most sensitive ears (usually children). Even at such high frequencies the pattern resembles that for 2 kHz pretty well with no "dead spots" in the center. Drag the frequency scroll bar down to 250 Hz. At 250 Hz and below, these speakers are omnidirectional (due to the way we defined the directivity pattern). Inspect lower frequencies where phase is considered. Notice that these speakers are acting as one now because they are so close together. Phase interference has not been eliminated, but it will be much less of a problem now.
Now click and drag the Analyzer icon within the sound map (the circle with an X in it). The frequency response window dynamically updates so that you can inspect the frequency response at any point in the area quickly. You may have already noticed that this configuration is still less than perfect (all are to some degree). It is left as an exercise for the student to discover why and develop a better solution (hint: front-row-center). Some possibilities to consider may be,
6. WinSound does not compute reverberation, so it is up to us to be aware of its potential effects. For further reading about reverberation, see Davis and Jones, page 57.
7. Of course, this is only true if the low-frequency distribution is well-controlled, as it now is in this example.
| previous |
|
|